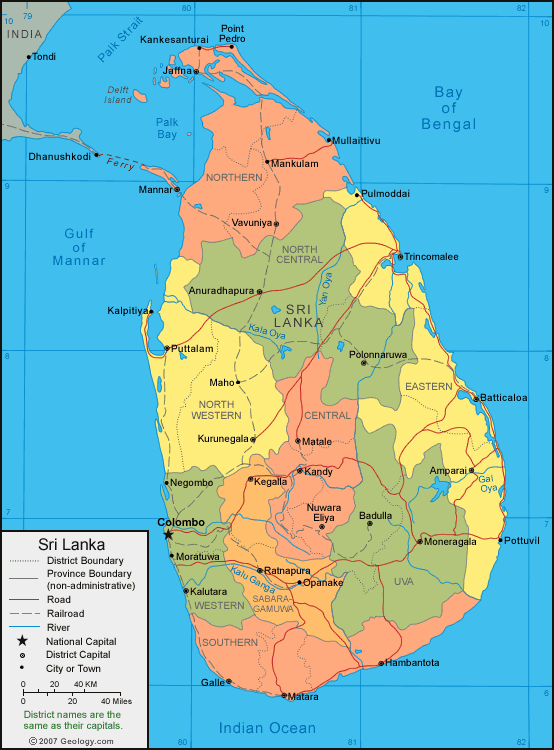
Democratic Socialist Republic of Sri Lanka
 Population: 19,668,000 (2005 est.)
Annual population growth rate: 1.2% (2005 est.)
Gender distribution:
- Male: 47.6%
- Female: 52.4% (2004 est.)
Ethnic groups:
- Sinhalese: 81.89%
- Sri Lankan Moors: 8%
- Indian Tamil: 5.08%
- Sri Lankan Tamil: 4.37%
- Other: 0.66% (2001 prov.)
Religions:
- Buddhist: 76.71%
- Muslim: 8.49%
- Hindu: 7.88%
- Christian: 6.06%
- Other: 0.86% (2001 prov.)
Languages:
- Sinhala (official and national language): 74%
- Tamil (national language): 18%
- Other: 8%
Note - English is commonly used in government and is spoken competently by about 10% of the population.
Literacy:
- Total population: 92.5%
- Male: 94.5%
- Female: 90.6% (2003 est.)
Government
Capital: Colombo
Note - Sri Jayewardenepura Kotte is the legislative capital.
Administrative divisions: Nine provinces - Central, North Central, Northern, North Western, Eastern, Sabaragamuwa, Southern, Uva, Western
 Executive branch:
- Head of state and Head of government: President Mahinda Rajapaksa (since 19 November 2005); the President is considered both the head of state and head of government.
- Cabinet: Cabinet appointed by the President in consultation with the Prime Minister
- Elections: President elected by popular vote for a six-year term; election last held 17 November 2005
Legislative branch: Unicameral Parliament (225 seats; members elected by popular vote on the basis of a modified proportional representation system by district to serve six-year terms)
Judicial branch: Supreme Court; Court of Appeals; judges for both courts are appointed by the President
Legal system: A highly complex mixture of English common law, Roman-Dutch, Muslim, Sinhalese, and customary law.
Independence: 04 February 1948 (from UK)
Constitution: Adopted 16 August 1978, certified 31 August 1978
Suffrage: 18 years of age; universal
Economy
GDP (purchasing power parity): Rs. 2366 billion (2005 est.)
Percapita GDP at Market Prices: Rs. 104,347 Million (2004 est.)
GDP - composition by sector:
- Agriculture: Rs. 175,182 Million
- Industry: Rs. 259,256 Million
- Services: Rs. 545,487 Million
Employment:
- Agriculture: 30.7%
- Industry: 24.5%
- Services: 44.8% (2005 est.)
Migration, Persons per 1000 households-
- Internal (within last 12 months): 29.0%
- External (within last 24 months): 60.5% (2001 est.)
.jpg)
Disclaimer
The material presented on this website is released under the Creative Commons Attribution-ShareAlike 3.0 Unported license , which allows free use, distribution, and creation of derivatives, so long as the license is unchanged and clearly noted, and the original author is attributed. Some of the works on this server may contain live references (or links) to information created and maintained by other organizations, the accuracy for which we are not responsible.The views expressed in the material on this website are personal to the respective authors and do not necessarily reflect any official view.

Processing Request
Please Wait...


